Introduction to BioCyc Genome and Metabolic Pathway Web Portal
The BioCyc web portal from SRI International contains integrated genome and metabolic-pathway databases for more than 20,000 sequenced organisms including 68 curated databases. BioCyc databases integrate a diverse range of data and provide a high level of curation. BioCyc includes an extensive suite of bioinformatics tools including a genome browser, metabolic network browser, metabolomics data analysis, transcriptomics data analysis, and metabolic route search.
BioCyc Pathway/Genome Databases (PGDBs) describe the genome of an organism, as well as its biochemical pathways; for a fraction of organisms regulatory networks are also present. New releases occur three times per year. BioCyc contains databases for humans, model eukaryotes, and for many bacteria.
For a full description of BioCyc bioinformatics tools please refer to the BioCyc Data Sheet or view the BioCyc overview video.
Purchase BioCyc Subscription
A subscription is required for ongoing access to BioCyc. Click a button below for pricing information.
Does your institution already have access? View our current list of institutional subscribers.
BioCyc Benefits and Features
- BioCyc Benefits: Better Science, Faster
- BioCyc Data Content
- Genome Informatics Tools
- Pathway Informatics Tools
- Transcriptomics Data Analysis Tools
- Metabolomics Data Analysis Tools
- Advanced Database Access
BioCyc Benefits: Better Science, Faster
Faster Science- Curators write mini-reviews for genes
[example]
and pathways
[example]
that distill the literature and save scientists time in searching, reading, synthesizing, and reconciling errors and disagreements in the literature
- BioCyc performs a vast integration of data to put more of the data you need at your fingertips -- see BioCyc Data Content tab
- Gene functions are more fully understood in their pathway and regulatory context
- Reduces the need to search other databases
- BioCyc SmartTables enable point-and-click operations for analytical tasks that would otherwise require programming
- BioCyc visualization tools speed information uptake and produce publication-quality figures for pathways, genome comparisons, and more. The genome browser enables you zoom to the sequence level in seconds.
- Build your science on a foundation of accurate and high-quality genome annotations and information distilled from 146,000 publications:
- Better hypothesis generation
- More complete experiment interpretation
- Higher quality publications and grant proposals
- BioCyc's data integration efforts enable computational analyses that would otherwise be impossible
- BioCyc's informatics tools are powerful and easy to use:
- Ultra-fast genome browser
- Pathway and subsystem-based analysis of metabolomics data
- Visualize transcriptomics and proteomics data on zoomable metabolic charts
- Design of optimized pathways for synthetic biology and metabolic engineering
- Comparison of metabolic networks
Pathway/Genome Web Portal for 20,000 Organisms
BioCyc contains 20,000 Pathway/Genome Databases (PGDBs) including 68 curated databases.
Computationally Generated Databases -- Tier 3
PGDBs are generated by combining an annotated genome with computationally inferred information and data imported from other databases, which can include:
- The genome, Gene Ontology terms, gene essentiality data
- The proteome, protein complexes, protein subcellular locations, protein features, Pfam domains, orthologs
- Metabolic pathways, reactions (including atom mappings), and metabolites
- Operons, transcription start sites, terminators, regulatory interactions
- Database links
Tier 3 (uncurated) eukaryotic databases in BioCyc include Rattus norvegicus, Mus musculus, Caenorhabditis elegans, Drosophila melanogaster, and Arabidopsis thaliana.
Manually Curated Databases -- Tiers 1 and 2
Manual curation integrates extensive information from the literature including experimentally determined genome annotations; metabolic pathways, reactions, and metabolites; protein complexes; enzyme activators, inhibitors, cofactors, and kinetic parameters; and transcriptional regulatory interactions and binding sites. Curators have written thousands of pages of mini-review summaries that distill key findings from the literature.Click for a full list of the Tier 1 and Tier 2 curated databases, which include the following.
- EcoCyc: The data in this Escherichia coli K-12 MG1655 database have been gathered during two decades of literature-based curation from more than 43,000 articles. EcoCyc describes the metabolic, transport, and regulatory machinery of E. coli. EcoCyc curators have authored the equivalent of 4,013 textbook-pages of mini-review summaries for E. coli genes and pathways.
- MetaCyc: Contains 3,128 metabolic pathways and 18,800 biochemical reactions from all domains of life. MetaCyc information was gathered from 76,000 publications to provide a comprehensive metabolic encyclopedia whose mini-review summaries encompass the equivalent of 10,600 textbook pages.
- YeastCyc: This highly curated metabolic network for Saccharomyces cerevisiae was curated from 47,000 publications.
- HumanCyc: This database was derived from a computational pathway analysis of the human genome, followed by literature-based curation of human pathways and enzymes.
- BsubCyc: The curated metabolic and regulatory networks for this Bacillus subtilis database cite 7,000 publications. Included are 180 regulatory genes controlling 1,200 regulated genes.
- Mycobacterium tuberculosis H37Rv, Staphylococcus epidermidis RP62A, Synechocystis sp. PCC 6803, Brucella ovis ATCC 25840, Helicobacter pylori 26695, Chlamydia trachomatis D/UW-3/CX, Vibrio cholerae N16961, Corynebacterium glutamicum ATCC 13032, Peptoclostridium difficile 630, and others.
Genome Informatics Tools
BioCyc provides a powerful and comprehensive set of features for querying, visualization, and analysis of BioCyc data and user data. Tools include sequence retrieval, BLAST search, sequence pattern search, multiple-sequence alignment, and the following.
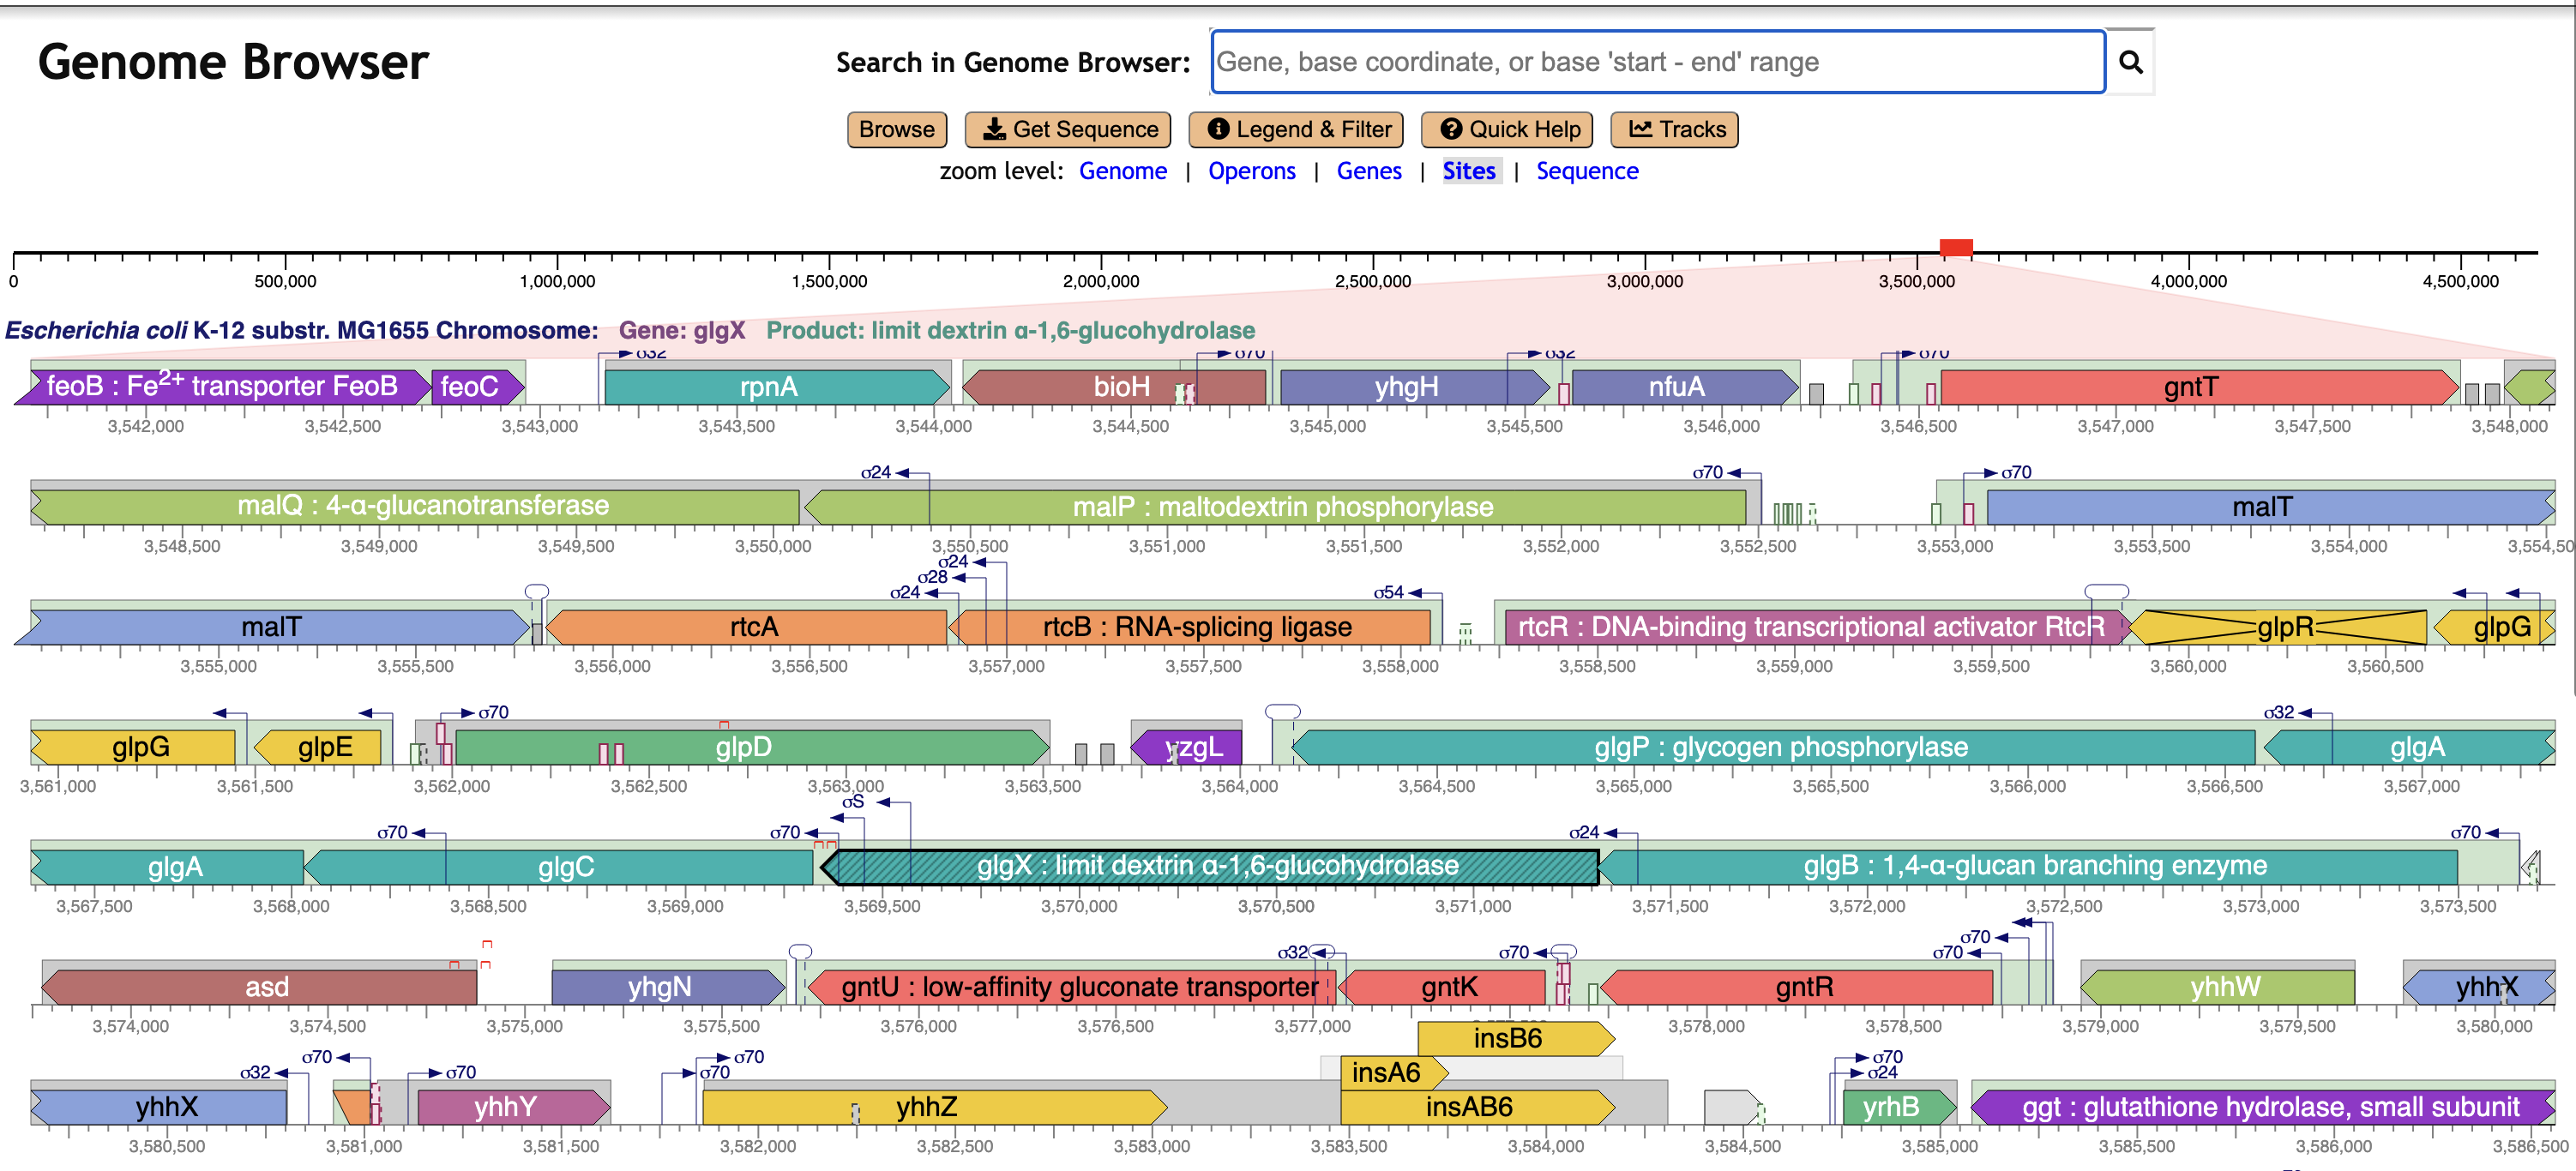
Genome Explorer Genome Browser
Genome Explorer supports real-time zooming to the sequence level using a mouse wheel or trackpad. Its multi-line diagrams provide high information density and intuitive depiction of genome elements.
Here the browser depicts a region of the E. coli K-12 chromosome; gene colors indicate operon organization. Promoters and terminators are depicted when known. Pseudogenes are marked with X's.
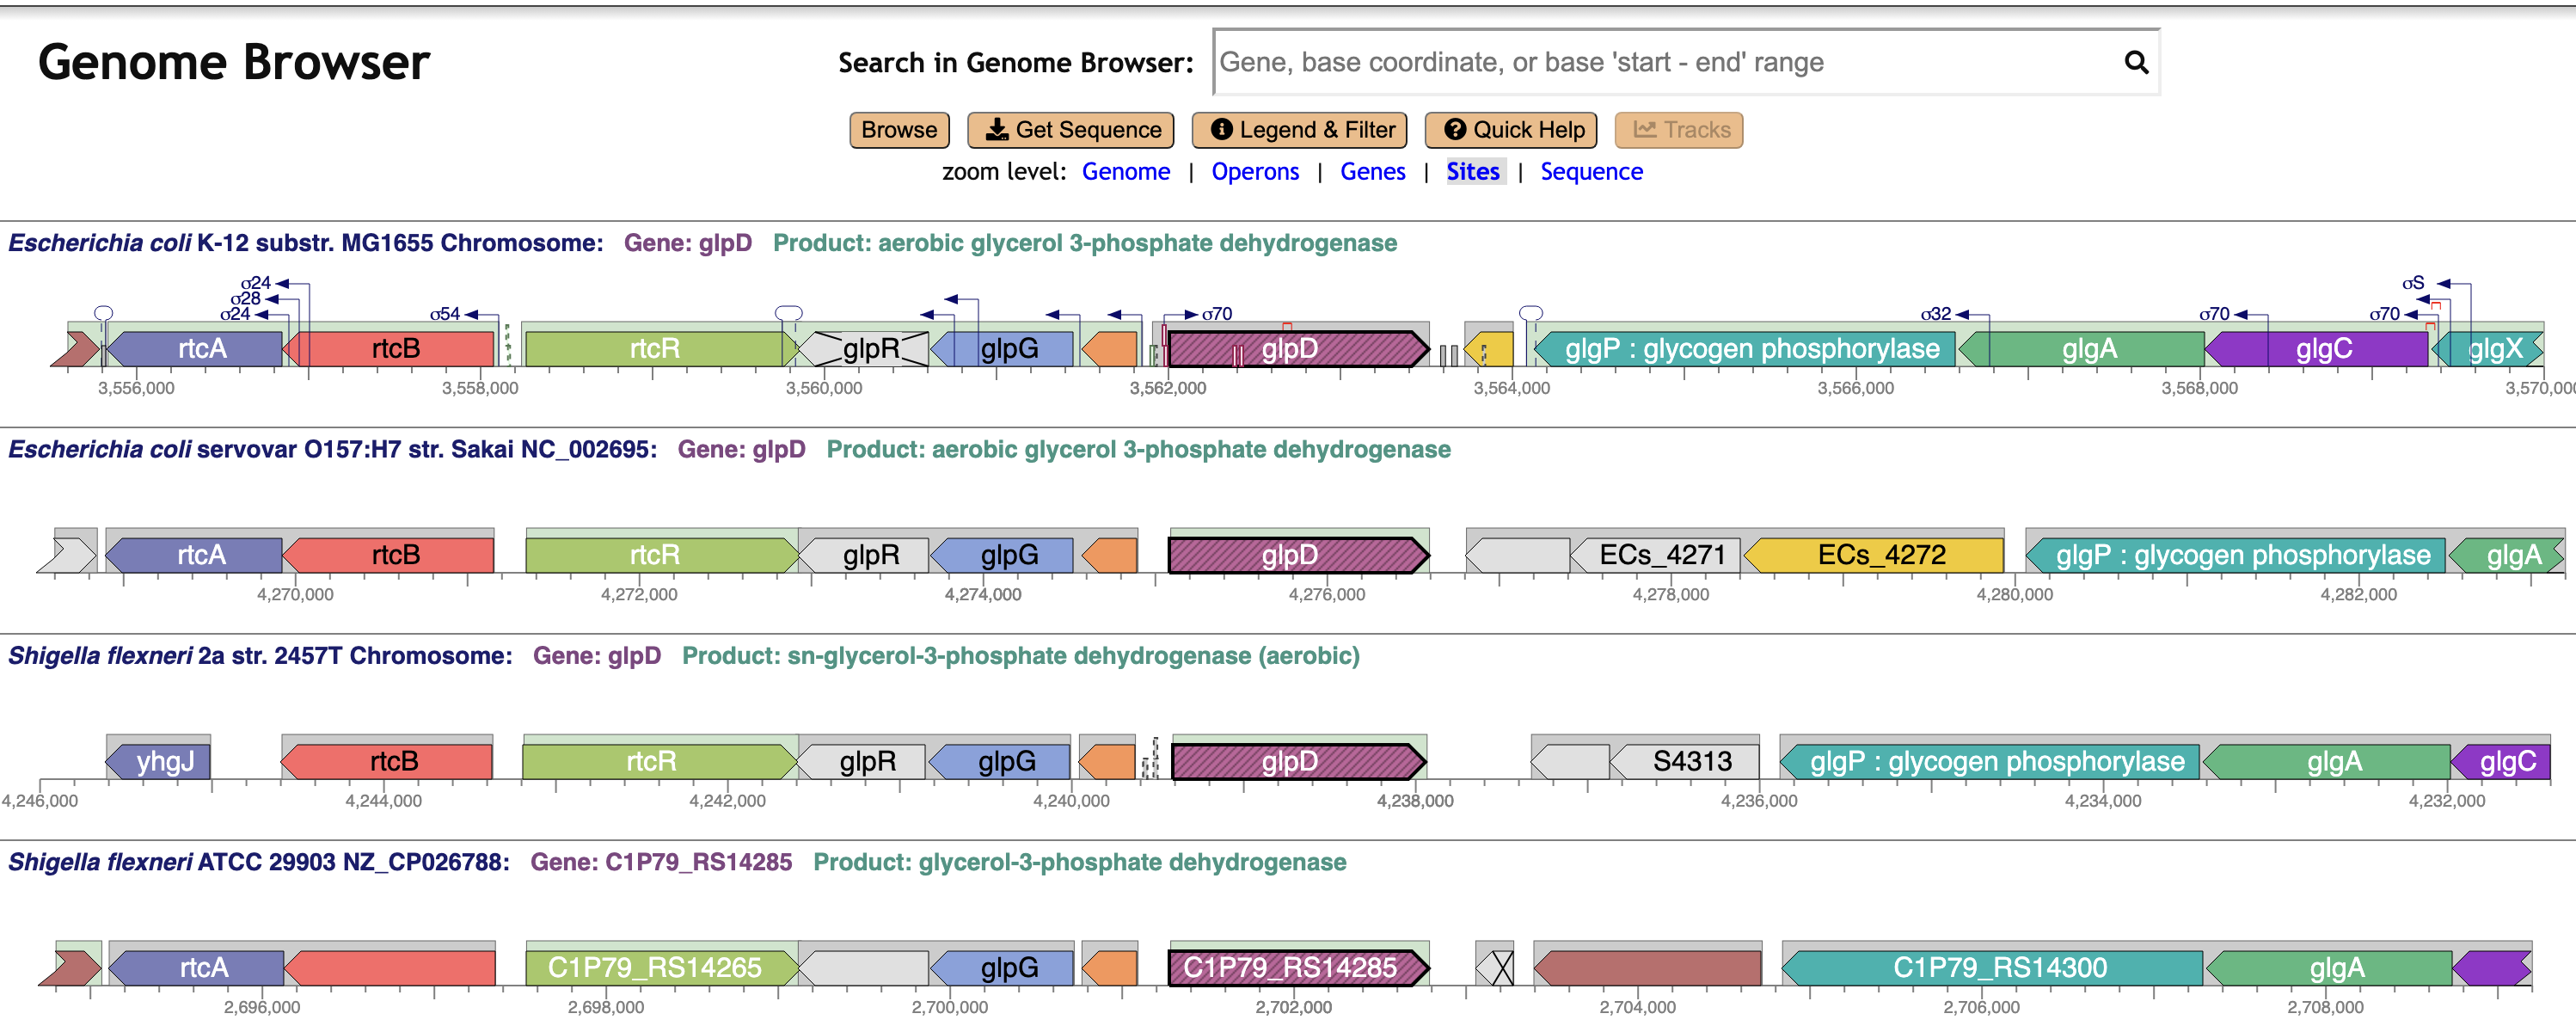
Genome Browser Comparative Mode
Aligns genome regions from user-selected organisms at orthologous genes.
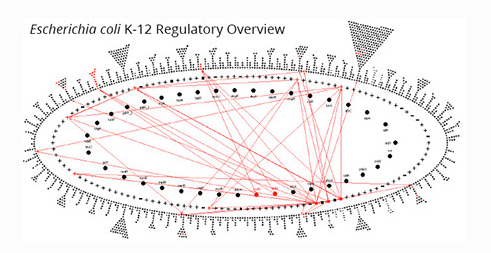
Regulatory Network Viewer
The Regulatory Overview depicts the transcriptional regulatory network in a PGDB; red arrows show user-requested regulatory relationships. The inner two rings are populated by transcription factors and sigma factors; the outer ring contains other, non-regulatory genes.
Pathway Informatics Tools
Pathway informatics tools include the following.
- Search tools and information pages for pathways, reactions, and metabolites
- Build multi-pathway diagrams called pathway collages
- Organism-specific zoomable metabolic network diagrams that can be printed as metabolic wall charts (see below)
- Interactive metabolic network explorer
- Metabolic route search
- Compute dead-end metabolites
- Compute choke-point reactions
Zoomable metabolic network diagram for Homo sapiens

Transcriptomics Data Analysis Tools
Tools for exploring transcriptomics data include enrichment analysis of gene sets for pathways, Gene Ontology biological processes, and regulators, and the following unique tools.
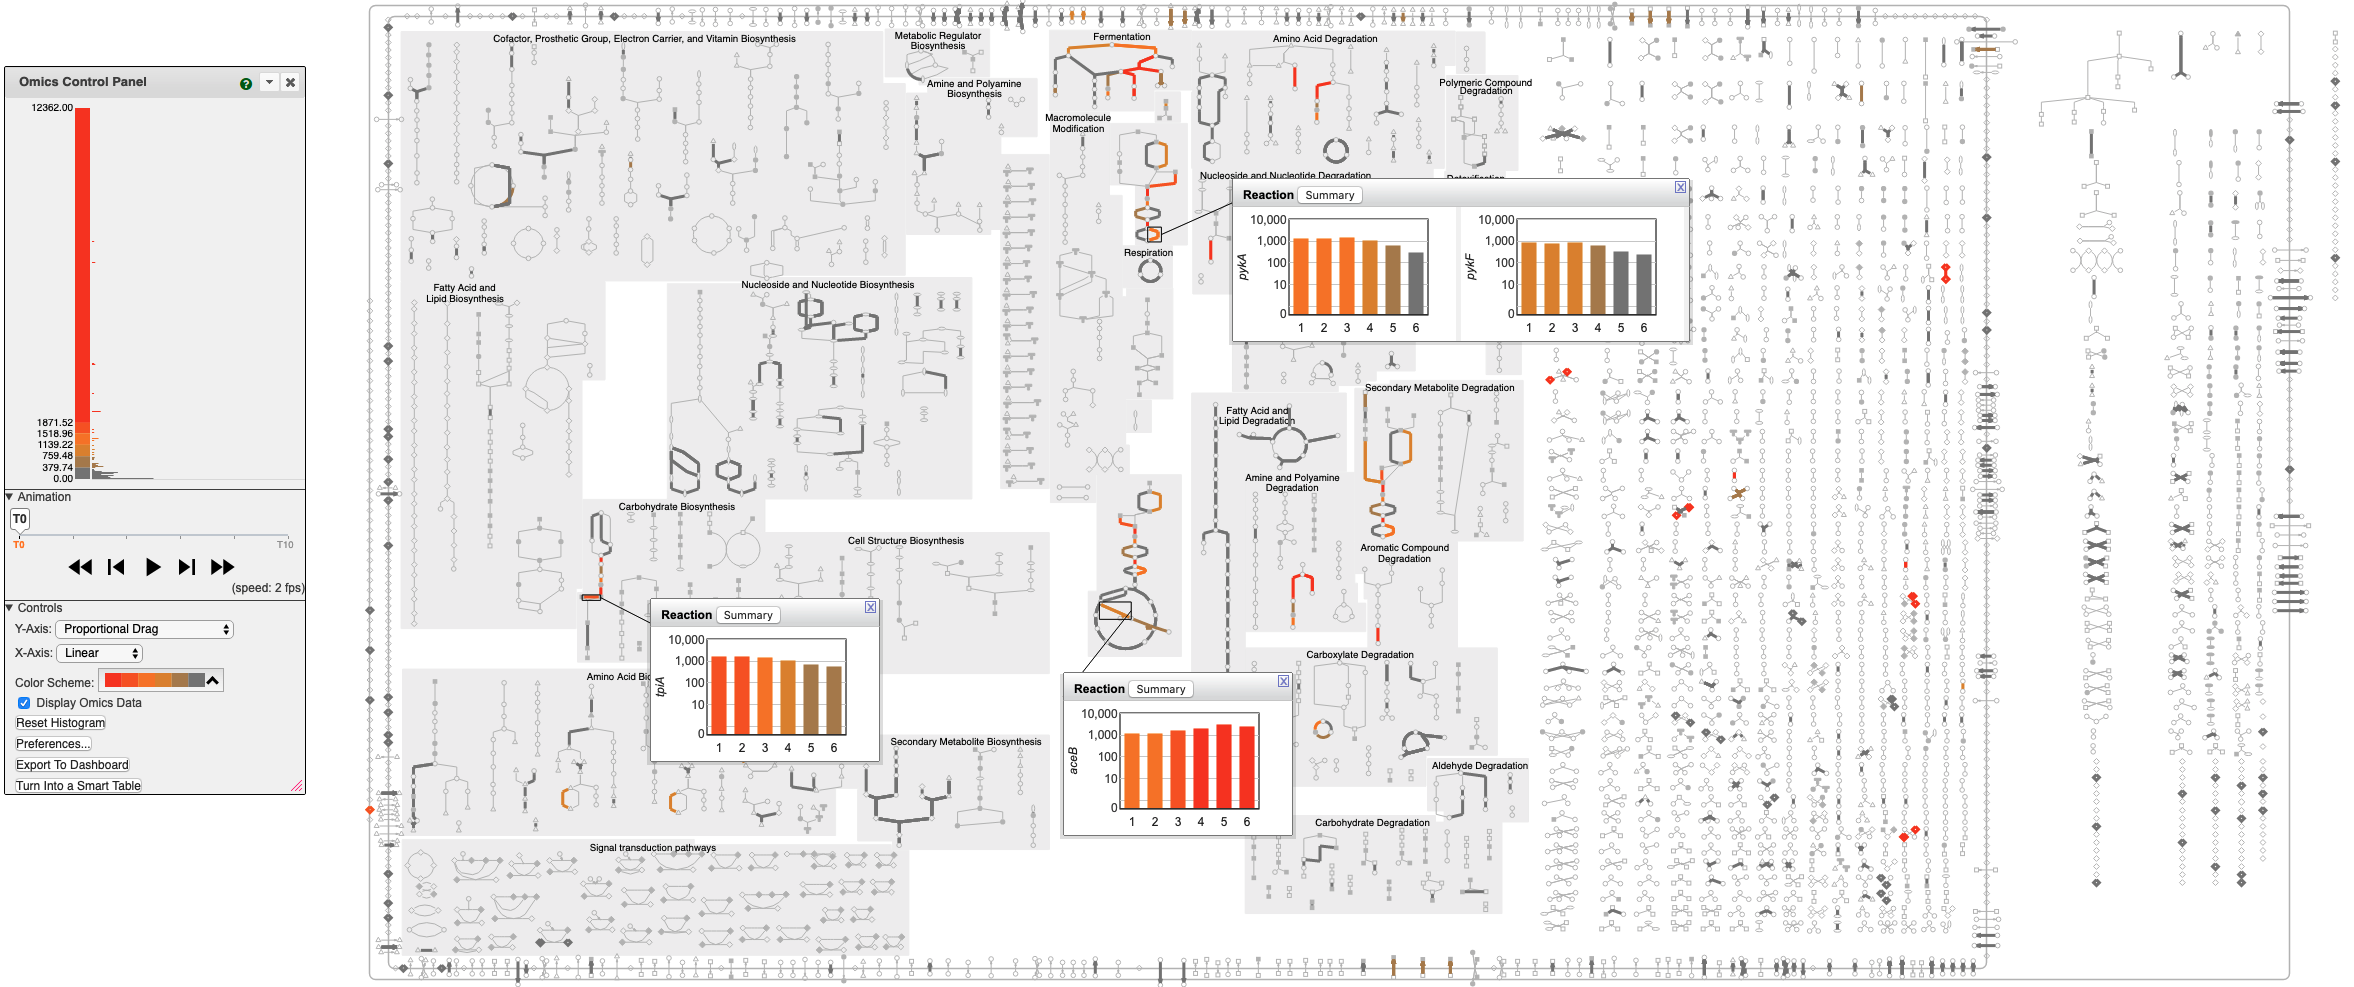
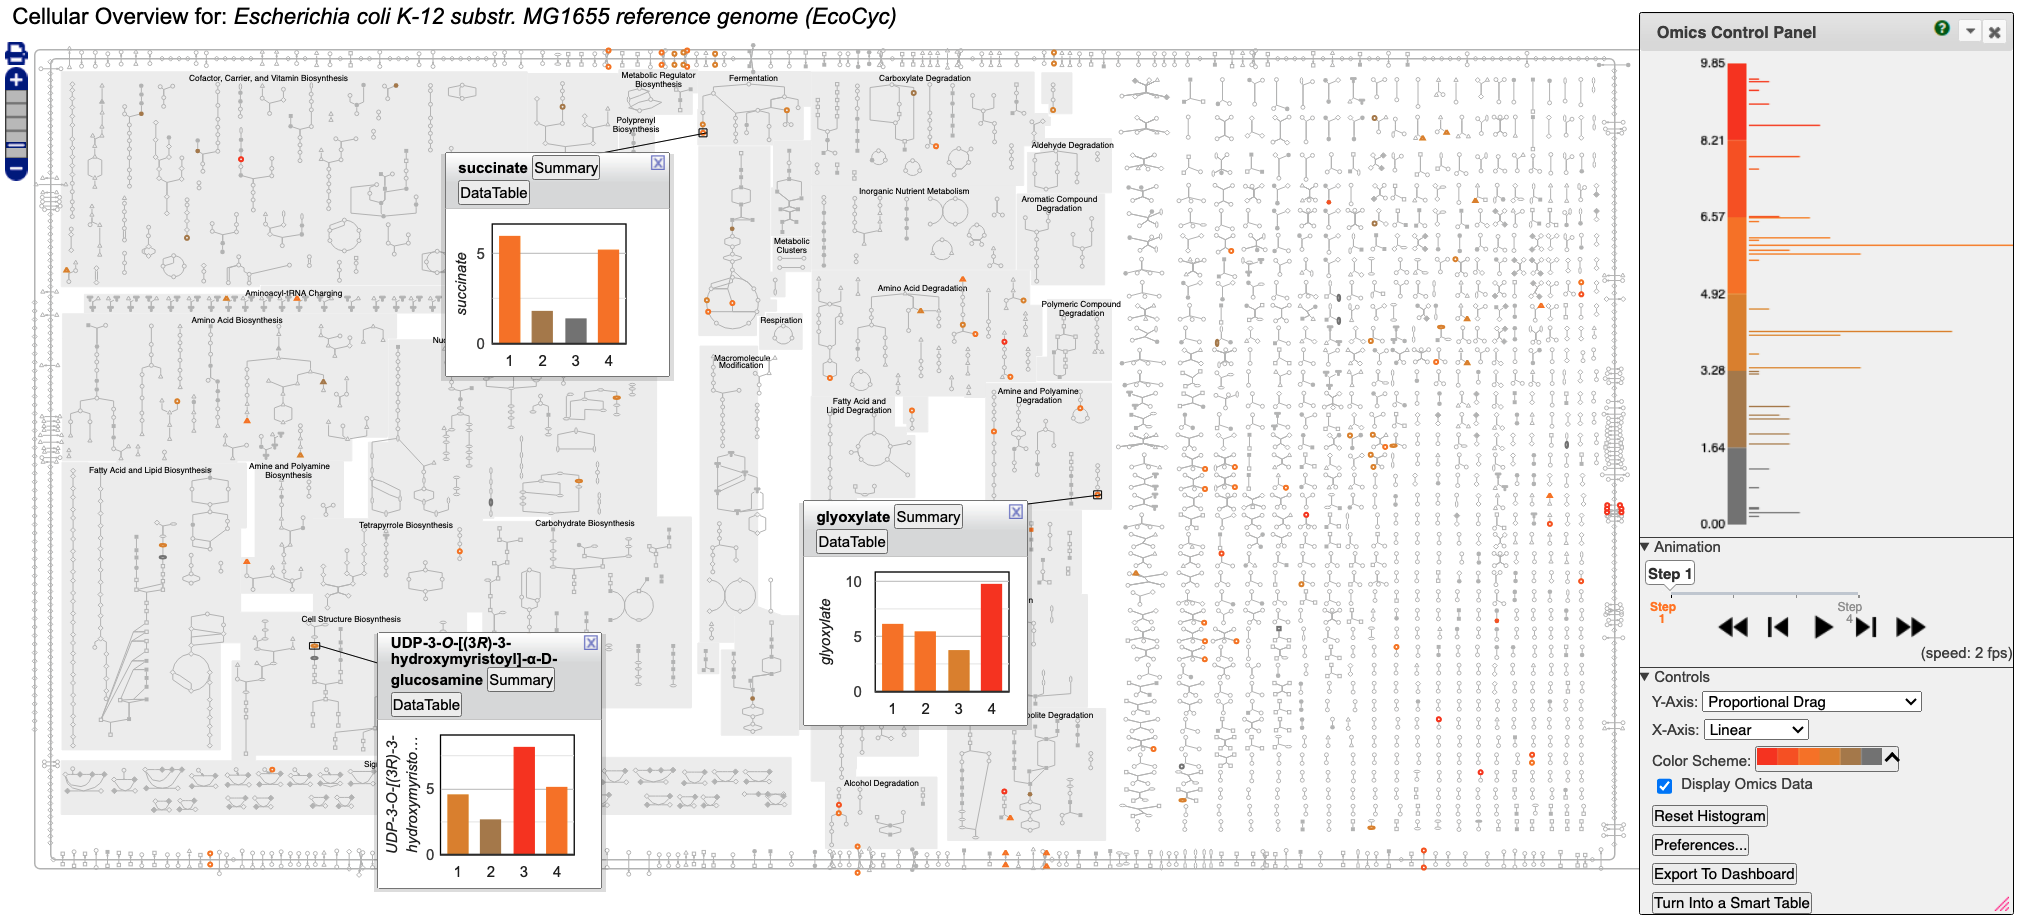
Cellular Omics Viewer
The BioCyc Cellular Omics Viewer enables the user to paint transcriptomics datasets onto zoomable organism-specific metabolic network diagrams. Scientists can interpret high-throughput datasets in a pathway context, including animation of time-course or comparative datasets. Reaction lines can be colored with gene expression, proteomics, or reaction flux data. Omics pop-ups graph omics data values using bar graphs, heat maps, or X-Y plots.
Add metabolomics data to a diagram by additionally painting metabolomics data onto metabolites.
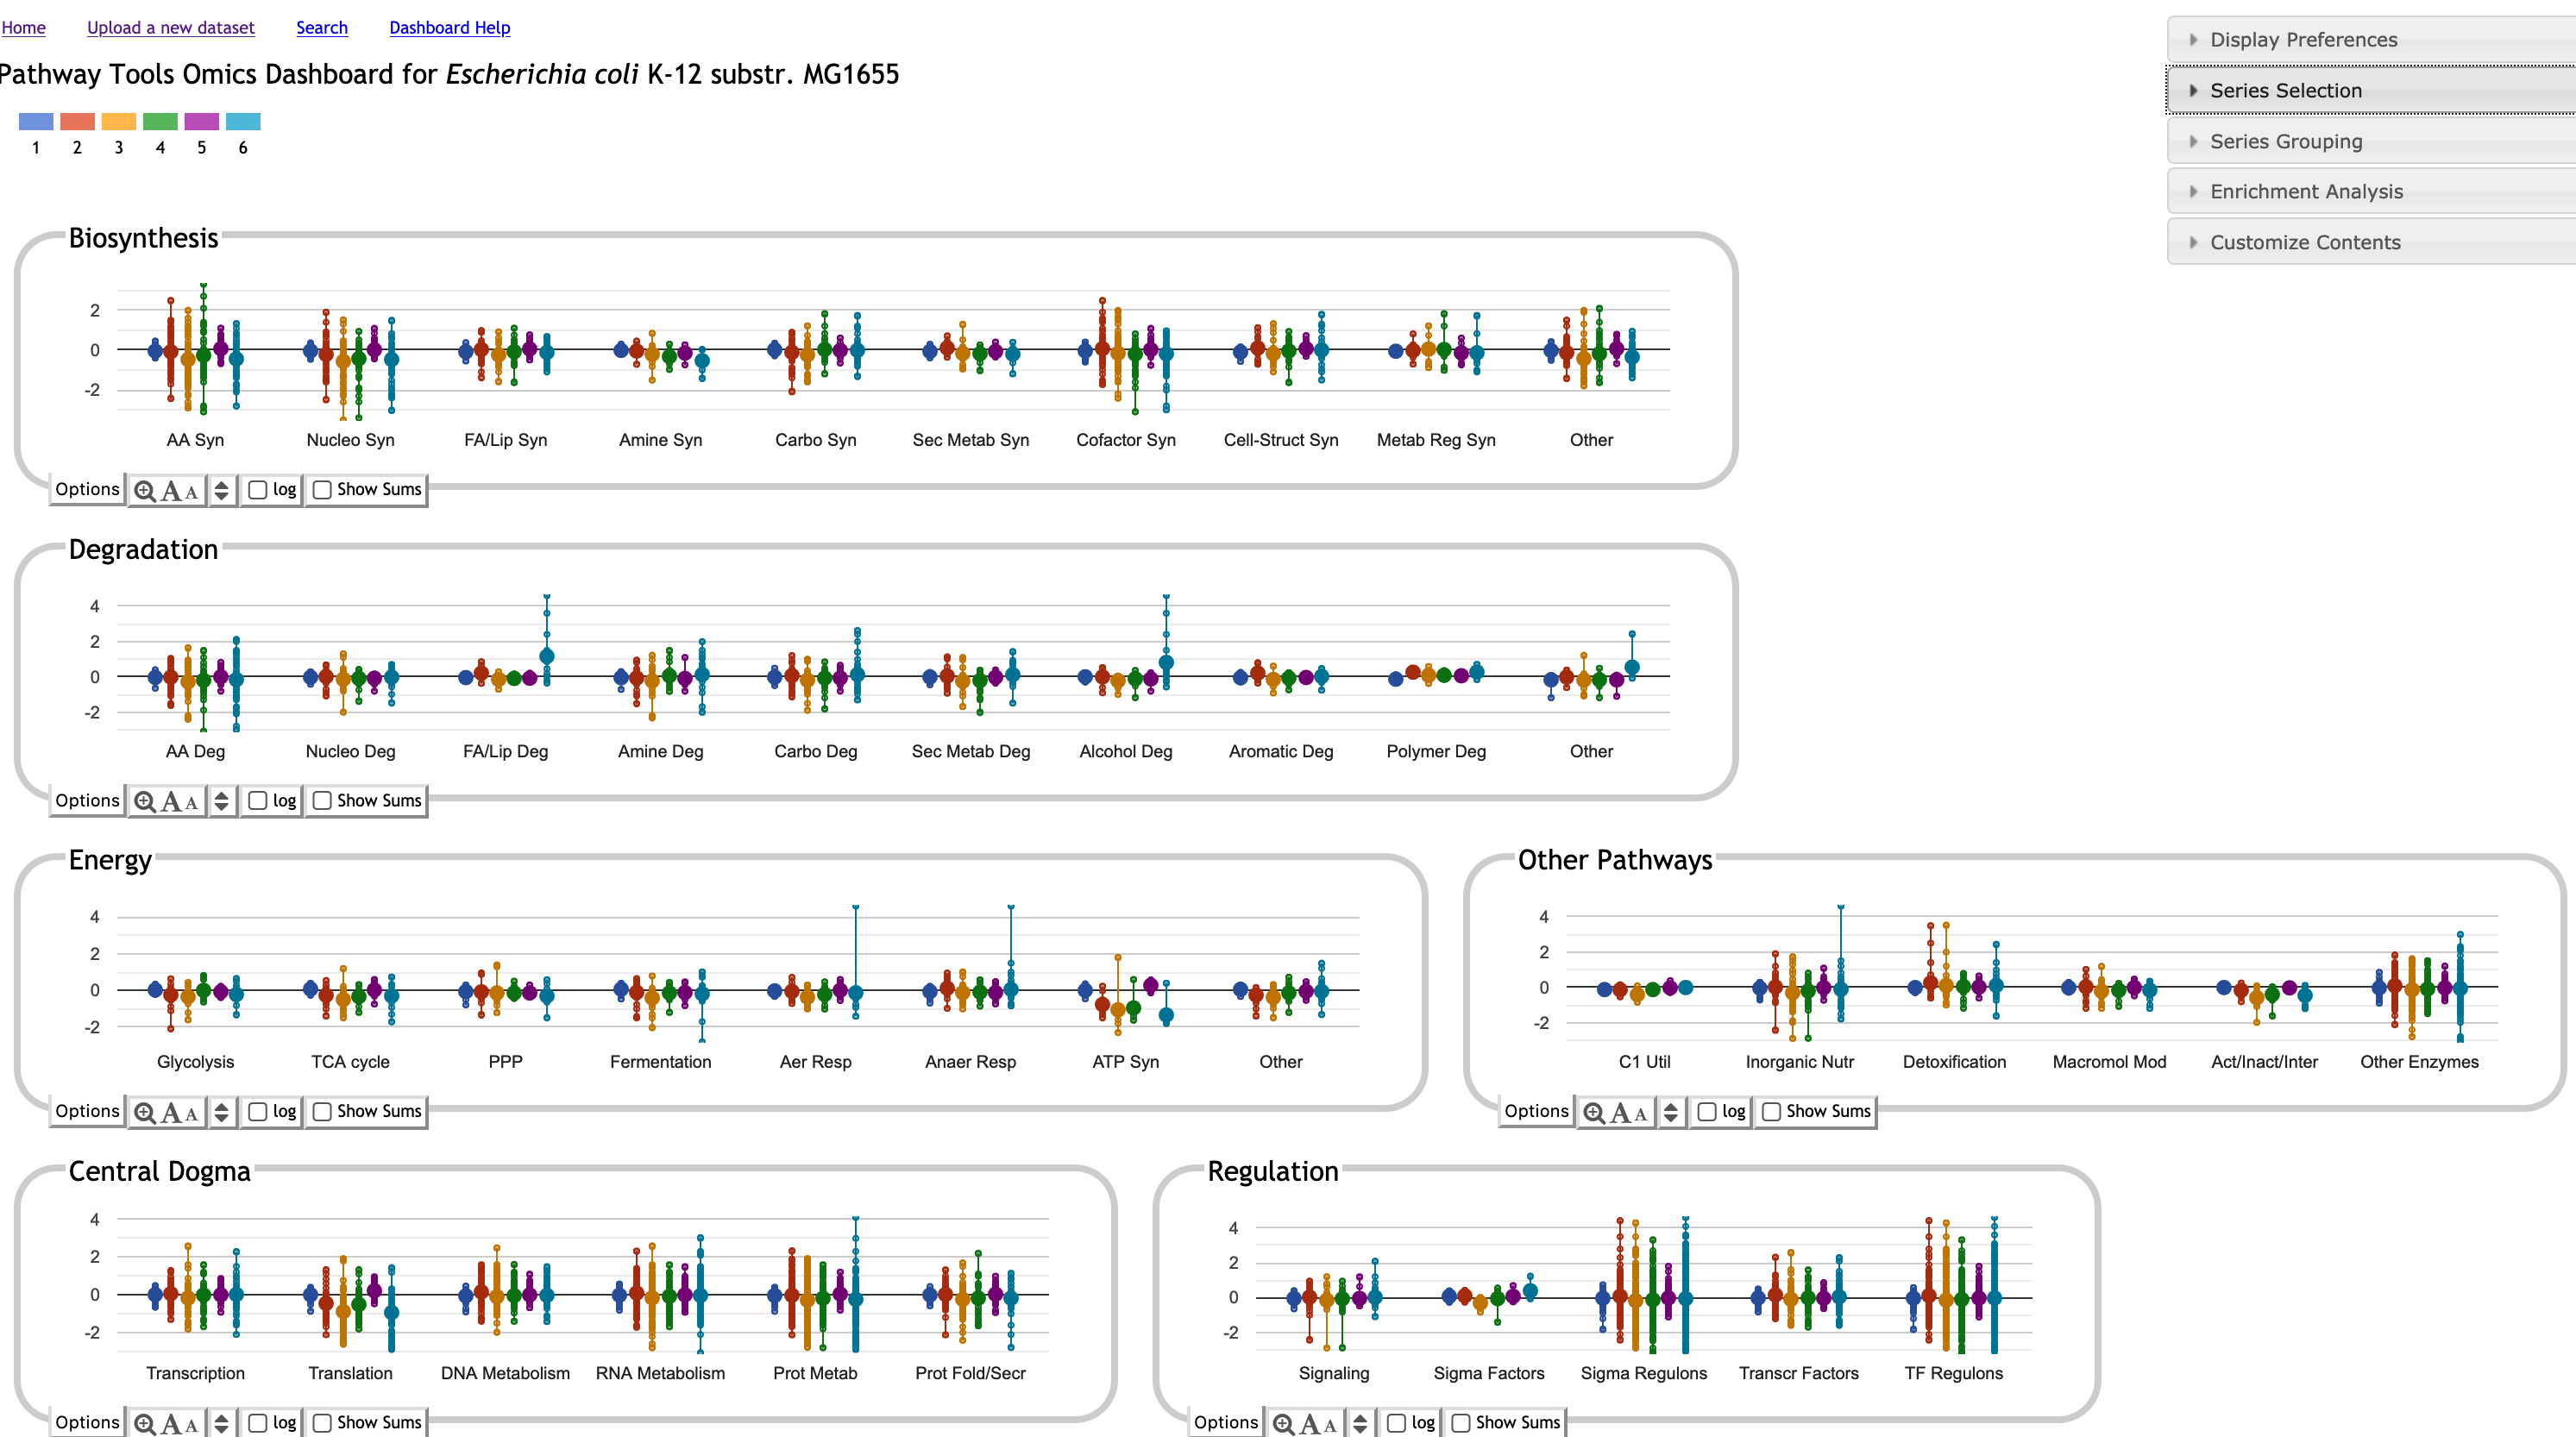
Omics Dashboard
The BioCyc Omics Dashboard enables the user to rapidly survey how all cellular systems are responding to a given stimulus. Scientists can quickly view the response of genes within one or more specific systems of interest, and can gauge the relative activity levels of different cellular systems. The Dashboard also enables comparison of expression levels of a cellular system with those of its known regulators. The Dashboard consists of a set of panels, each representing a system of cellular function. Each panel shows a graph depicting omics data for each of a set of subsystems. Multiple timepoints or experimental conditions are plotted as separate data series within the graphs. Clicking on a panel drills down into its component subsystems.
Metabolomics Data Analysis Tools
Tools for exploring metabolomics data include enrichment analysis of metabolite sets for pathways, search by chemical formula and monoisotopic mass, computation of metabolite-covering sets, and the following unique tools.
Cellular Omics Viewer
The BioCyc Cellular Omics Viewer enables the user to paint metabolomics datasets onto zoomable organism-specific metabolic network diagrams. Scientists can interpret high-throughput datasets in a pathway context, including animation of time-course or comparative datasets. Metabolite nodes in the diagram can be colored with metabolomics measurements. Omics pop-ups graph data values using bar graphs, heat maps, or X-Y plots.
Add transcriptomics data to the diagram by additionally painting transcriptomics data onto reaction lines.
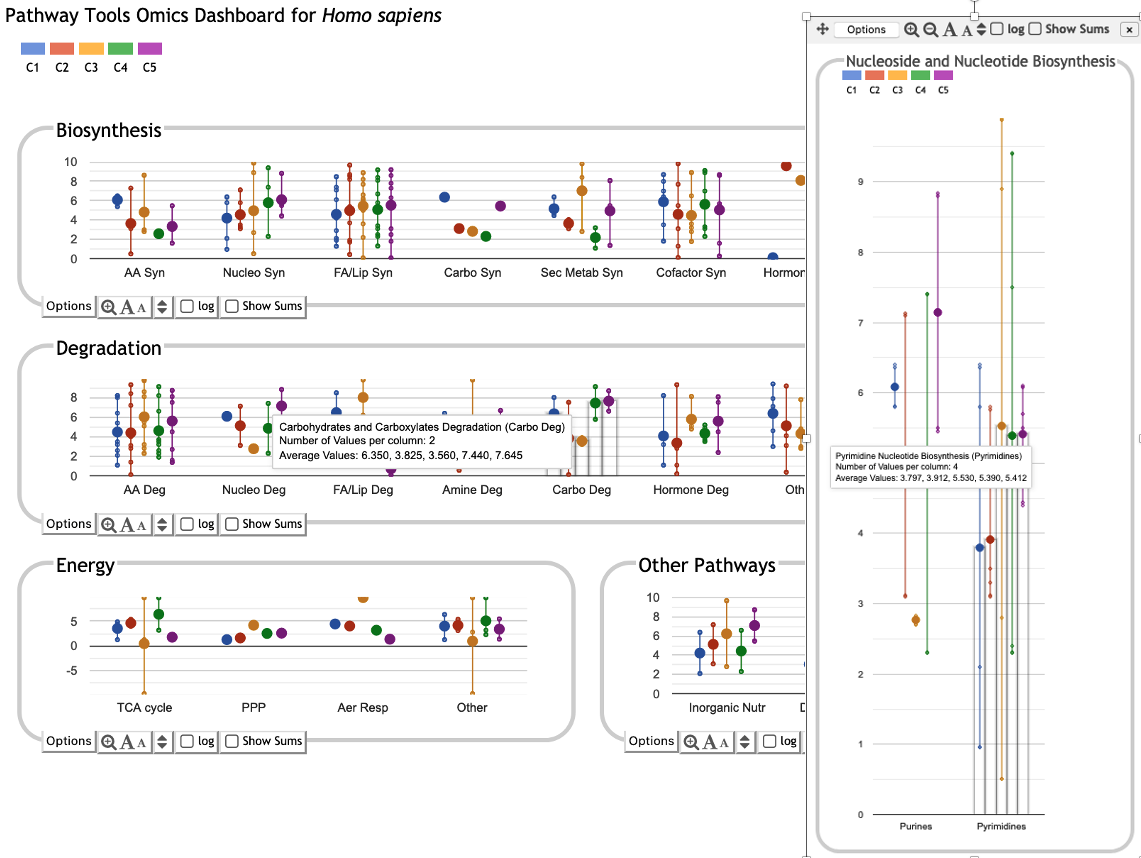
Omics Dashboard
The BioCyc Omics Dashboard enables the user to rapidly survey how all cellular systems are responding to a given stimulus. Scientists can quickly view the metabolite abundances within one or more specific systems of interest, and to gauge the relative activity levels of different cellular systems. The Dashboard consists of a set of panels, each representing a system of cellular function. Each panel shows a graph depicting omics data for each of a set of subsystems. Multiple timepoints or experimental conditions are plotted as separate data series within the graphs. Clicking on a panel drills down into its component subsystems.
Advanced Database Access
- Extensive search tools available under Tools > Search menu
- The Structured Advanced Query Form enables intuitive construction of database queries of SQL power using a Web-based interface
- Extensive web services APIs provided
- APIs available for Python, Perl, Java, R, and Lisp